Options Education · Pillar Guide
Options Trading for Beginners: The Complete Guide to Calls, Puts, Greeks & GEX
Everything you need to go from “what is a call option?” to reading dealer gamma exposure like a desk trader — in one plain-English, illustrated guide.
What is an option?
An option is a derivative: a contract whose value is derived from another instrument, called the underlying asset. An SPX option derives its value from the S&P 500 index; an Apple option derives its value from Apple stock. The option is the contract, the underlying is the thing the contract is about — and that relationship between the two is where all the interesting mechanics in this guide come from.
The formal definition is simple once you unpack it. An option gives the holder the right, but not the obligation, to buy or sell the underlying asset at a fixed price, on or before a set future date. The fixed price is the strike price. The set date is the expiration. The freedom to walk away is why it’s called an option in the first place.
The best mental model is insurance. When you buy home insurance you pay a premium today for protection against something that may or may not happen. If nothing happens, the premium is gone and that’s fine — that was the cost of protection. If disaster strikes, the policy pays out far more than you paid. Options work the same way: the buyer pays a premium for an asymmetric payoff, and the seller collects that premium in exchange for taking on the obligation to make good on the contract if the buyer exercises it.
One contract normally controls 100 units of the underlying (the multiplier). So an option quoted at $2.00 costs $200 to buy — and that built-in leverage is both why options can return 50–100% on small moves and why they can go to zero just as fast.
Two housekeeping details you’ll see everywhere: American-style options (most stock options) can be exercised any time up to expiration, while European-style options (index options like SPX) can only be exercised at expiration. And time-to-expiry is written as DTE — days to expiration — so a “45 DTE call” expires in 45 days and a “0DTE” contract expires today.
Calls and puts explained
Every options position in existence is built from just four building blocks: buying a call, buying a put, selling a call, selling a put.
A call option is the right to buy the underlying at the strike. You buy a call when you believe price will be above the strike by expiration. Say you buy a call with a $90 strike for a $2.00 premium ($200 total). If the stock finishes at $100, you can exercise your right to buy at $90 and immediately sell at $100 — or, far more commonly, just sell the option itself for its new, higher price. If the stock finishes at $80, exercising makes no sense (why buy at $90 what trades at $80?), the option expires worthless, and your loss is exactly the $200 you paid. Never more — whether the stock lands at $80 or crashes to $10.
A put option is the mirror image: the right to sell the underlying at the strike. You buy a put when you expect price to fall below the strike — or when you own shares and want downside protection. This protective use is the original purpose of options: a fund holding a large stock position can buy puts instead of selling shares, capping its downside without triggering taxes and transaction costs on the whole position.
Now flip to the other side of each trade. Whoever sold you that call or put is your insurer. They collected the premium up front, and that premium is the most they can ever make. In exchange, they carry the obligation: if you exercise, the call seller must deliver the underlying at the strike, and the put seller must buy it at the strike — no matter where the market is trading. That’s why the buyer’s risk is capped and the seller’s risk is open-ended.
A subtlety that trips up beginners: bullish doesn’t only mean “buy calls.” If you want to benefit from a move higher, you can buy a call or sell a put. If you want to benefit from a move lower, you can buy a put or sell a call. Combine the four blocks across strikes and expirations and you can build effectively unlimited structures — which is exactly what the institutions whose flow shows up in gamma-exposure data do every single day.
Moneyness: ITM, ATM and OTM
Moneyness describes where an option’s strike sits relative to the current price of the underlying — in other words, whether exercising it right now would be worthwhile.
For a call: if the strike is below the current price, the option is in the money (ITM) — the right to buy cheap already has real value. If the strike equals the current price it’s at the money (ATM), and if the strike is above the current price it’s out of the money (OTM). For a put it’s the mirror image: strikes above the current price are ITM, strikes below are OTM.
Moneyness is dynamic. Buy an ATM $500 call and watch the stock rally to $600 — your option is now deep ITM. If the stock slides to $400 instead, the same contract is OTM. Traders choose strikes deliberately: ITM contracts cost more but behave more like the stock and bleed less to time; OTM contracts are cheap lottery-ticket exposure that needs a real move to pay; ATM contracts are where time value — and, as we’ll see, gamma — is at its maximum.
What you actually pay for: intrinsic and extrinsic value
Every option premium splits into two parts. Intrinsic value is what the option would be worth if exercised right now — for a call, current price minus strike (if positive); for a put, strike minus current price. Only ITM options have any. Extrinsic value is everything else: payment for time remaining and for expected volatility. An ATM or OTM option is 100% extrinsic value — pure possibility, melting a little every day.
This split explains most beginner confusion about “why is my option down when the stock is up?” If you own an OTM call, you own only extrinsic value, and two forces attack it constantly: the passage of time and any drop in implied volatility. The stock can drift slowly in your direction while your premium still bleeds out. Direction alone is not enough — you need enough move, fast enough. That’s the trade-off the Greeks quantify.
How to read an option chain
The option chain is the menu. Open any broker — Thinkorswim, Tastytrade, IBKR, Robinhood — pick an underlying like SPX, and you’ll see the same layout everywhere: expirations listed down the side (0DTE, 1DTE, weeklies, monthlies, out to LEAPS years away), strikes running down the middle, calls on one side, puts on the other, and for every contract a bid (what buyers are offering) and an ask (what sellers want).
Three practical things matter more than anything else when you’re new. First, the bid–ask spread is a real cost: cross it carelessly on an illiquid strike and you start every trade down several percent. Second, volume and open interest tell you where the liquidity lives — unlike shares, every strike and expiration trades separately, and dead strikes have brutal spreads. Third, the chain shows implied volatility per expiration, which is the market’s own forecast of movement and the single most underrated number on the screen.
Note the trading hours quirk: standard equity options trade 9:30–16:00 ET only. Your premium is frozen overnight even while futures move — one more reason short-dated options are a different sport from shares or futures.
The Greeks, demystified
The Greeks measure how an option’s price responds to each force acting on it, holding everything else constant. Formally they’re partial derivatives of a pricing model like Black–Scholes; practically, they’re the dashboard gauges of your position. You don’t need the math — you need the intuition, because the Greeks are also the bridge between ordinary options trading and the dealer hedging flows that create gamma exposure.
Delta — direction
Delta tells you how much the option’s price changes when the underlying moves $1. A delta of 0.50 means a $1 move in the stock moves the option about $0.50 (× the 100 multiplier = $50 per contract). Deep OTM options have delta near 0 — the stock wiggles, they barely react. Deep ITM options have delta near 1 — they track the stock almost dollar for dollar. ATM options sit near 0.50, which also loosely reads as “the market gives this a coin-flip chance of expiring ITM.”
Gamma — acceleration
Gamma is the Greek this whole site is named after. It’s a second-order Greek: it measures how fast delta itself changes as price moves. If delta is your position’s velocity, gamma is its acceleration. Plot delta against the underlying and you get an S-curve; gamma is the slope of that curve, a bell that peaks exactly at the strike.
Two properties of gamma matter enormously. It concentrates at the money, and it concentrates near expiration — an ATM option with hours left has many times the gamma of the same strike three weeks out. High gamma is why 0DTE premiums can double in minutes, and it’s also why the dealers on the other side of those trades are forced into the aggressive hedging that moves whole indices. Delta risk can be hedged by trading the underlying; gamma risk can only be managed. Hold that thought.
Theta — time
Theta is time decay: how much value the option loses each day, all else equal. Buyers have negative theta — they bleed daily. Sellers have positive theta — they collect that bleed. Theta hits ATM options hardest and accelerates into expiration, which is why holding long OTM options into their final days is usually a slow donation to the seller. Theta isn’t free money for sellers, though: it’s compensation for carrying the open-ended risks of big moves and volatility spikes.
Vega — volatility
Vega measures sensitivity to changes in implied volatility. If your option has vega of 0.10 and IV rises five points, your premium gains about $0.50 — with the stock going nowhere. Vega is largest ATM and with more time remaining. It’s the Greek that makes options a two-dimensional bet: you’re trading direction and the market’s expectation of movement, at the same time.
Rho — interest rates (and the second-order Greeks)
Rho measures sensitivity to interest rates and mostly matters for long-dated options. Beyond the first-order Greeks live second-order ones — vanna (how delta shifts with volatility) and charm (how delta bleeds with time) being the two that professional flow traders actually watch, because both force dealers to re-hedge even when price is standing still. Charm is the reason many gamma traders trust their levels most in the first two hours of the session and get cautious in the afternoon, when time-driven re-hedging picks up.
| Greek | Answers the question | Long options | Short options |
|---|---|---|---|
| Delta | What happens if price moves $1? | calls +, puts − | calls −, puts + |
| Gamma | How fast does my delta change? | positive | negative |
| Theta | What does one day cost me? | negative (you bleed) | positive (you collect) |
| Vega | What if implied volatility moves 1 pt? | positive | negative |
Implied volatility and the IV crush
Implied volatility (IV) is the market’s consensus forecast of how much the underlying will move between now and expiration, reverse-engineered from option prices themselves. High IV means expensive options; low IV means cheap ones. It has less to do with direction than with uncertainty — which is why IV spikes into earnings, Fed meetings and macro shocks, when nobody knows what happens next.
The classic trap is the IV crush. Before earnings, uncertainty pumps IV and premiums balloon. The moment results hit, uncertainty collapses — and so does IV. A trader who buys calls the day before earnings can watch the stock gap up and still lose money, because the vega loss from collapsing IV outweighs the delta gain from the move. If you remember one thing about IV as a beginner, make it this: always ask whether you’re buying options when they’re expensive.
One structural fact worth knowing: institutions persistently buy OTM puts as portfolio insurance so they can sleep at night. That constant demand keeps implied volatility — especially on the put side — slightly rich relative to the volatility that actually gets realized. This “volatility risk premium” is the reason systematic option-selling strategies have a structural edge on paper, and the reason that edge occasionally gets erased in a single crash.
Buying vs selling options
Buying options gives you capped risk, uncapped reward and negative theta: you’re paying rent daily and you need to be right about direction, size and timing. Most cheap OTM options expire worthless — the coin-flip framing hides the fact that time is always working against you.
Selling options gives you high win rates, immediate income and positive theta — with the tail risk attached. Sell a 10-delta SPX put and you might win 90%+ of the time, collecting premium month after month… until one volatility spike hands back a year of gains at once. Every experienced seller’s real edge isn’t the entry; it’s the risk management that keeps the one bad month survivable.
Neither side is “better.” Buyers rent convexity; sellers underwrite it. What matters is knowing which trade you’ve actually put on — and never selling unhedged (“naked”) options while you’re still learning.
Core options strategies (from training wheels to structures)
Strategies are just combinations of the four building blocks. A few cover 90% of what real traders use:
| Strategy | Build | You’re betting that… | Risk profile |
|---|---|---|---|
| Covered call | own 100 shares + sell 1 call | stock drifts sideways/up slowly | income now, upside capped |
| Cash-secured put | sell put + hold cash for assignment | you’d happily buy the stock lower | income now, obligated to buy on a drop |
| Bull call spread | buy call + sell higher-strike call | moderate move up | both risk and reward capped |
| Bear put spread | buy put + sell lower-strike put | moderate move down | both risk and reward capped |
| Straddle / strangle | buy call + put (same / different strikes) | a big move, direction unknown | premium-heavy, needs movement fast |
| Iron condor | sell strangle + buy wings | price stays inside a range | defined risk, income if it pins |
| Collar | own shares + buy put + sell call | protect a position cheaply | downside capped, upside capped |
| Calendar spread | sell near-dated + buy longer-dated | price sits still while near theta burns | defined risk, harvests time difference |
Two are worth flagging beyond the table. The collar is what large funds — famously JPMorgan’s hedged-equity program — run at massive size: give up some upside, cap the downside, suppress portfolio volatility. And the iron condor matters even if you never trade one, because institutional condor flow is a daily fixture in index options. When a desk sells thousands of condors betting tomorrow stays in a range, the strikes of that structure become exactly the kind of concentrated positioning that shows up on a GEX chart as walls — real information about where big players expect price to stall.
0DTE options: the fastest game on the board
0DTE contracts expire the same day. SPX, NDX and the big index ETFs now list expirations every single trading day, and same-day contracts have grown to a dominant share of index options volume. The appeal is obvious: premiums cost a fraction of weekly contracts and a single strong candle can return 50–100%. The physics is the gamma chart above — near expiry, ATM gamma is enormous, so premiums respond violently to every tick.
The same physics cuts the other way. Theta on a 0DTE isn’t a daily drip; it’s an hourly torrent. Buy an OTM 0DTE lottery ticket, watch price chop sideways for ninety minutes, and the premium is simply gone. There is no “waiting for it to come back” — the contract dies at 4pm.
For this guide, 0DTE matters for a bigger reason: it concentrates staggering amounts of gamma into single strikes for single sessions. That flow forces dealers into intraday hedging that can dominate index price action — which is precisely what session-level gamma exposure data measures, and why intraday traders who’ve never bought an option in their lives still watch GEX levels on ES and NQ.
Market makers and delta hedging: who’s on the other side
When you buy or sell an option, the counterparty is usually not another retail trader. It’s a market maker or dealer — a liquidity provider quoting both bid and ask, all day, on thousands of contracts. Dealers don’t make money predicting direction; they make money on the spread. Their mandate is to stay delta-neutral: whatever risk your trade hands them, they hedge it.
Here’s the crucial chain of logic. Your Greeks become the dealer’s mirror image. Buy a call and you’re long delta and long gamma — so the dealer who sold it is short both. To neutralize the delta, the dealer trades the underlying itself: selling shares or futures against positive delta, buying against negative delta. This is delta hedging, executed continuously by algorithms, and it is the direct mechanical pipe through which the options market moves the stock and futures markets.
But hedging delta doesn’t remove gamma. The moment price moves, delta is wrong again and the dealer must re-hedge. Which way they’re forced to trade depends entirely on the sign of their gamma — and that single sign determines the character of the whole market:
When dealers are long gamma, a rally makes their delta positive, so they sell into it; a dip makes it negative, so they buy. Their hedging leans against every move — volatility gets compressed, ranges hold, price mean-reverts. When dealers are short gamma, the same logic inverts: rallies force them to buy, dips force them to sell. Their hedging amplifies every move — trends extend, selloffs cascade, and price can travel violently with no fundamental catalyst whatsoever. If you’ve ever watched an index melt down on no news, you’ve watched a short-gamma feedback loop.
Gamma exposure (GEX): the market’s hidden map
Gamma exposure (GEX) is the net gamma dealers hold, aggregated across every strike and expiration. It converts everything above into a practical question: if price moves one point, how many dollars of the underlying are dealers mechanically forced to buy or sell — and at which prices does that pressure concentrate?
GEX isn’t a single number; it’s a profile by strike, because each strike contributes its own concentration of hedging pressure. Traditional technical analysis is backward-looking — it tells you where price has been, like driving by the rear-view mirror. A GEX profile is forward-looking and mechanical: it maps where hedging flows will kick in before price gets there. Strikes with heavy positive gamma behave like thickening liquidity — shock absorbers. Strikes with heavy negative gamma behave like thinning ice — accelerants.
The key GEX levels: call wall, put wall, zero gamma
Call wall — the mechanical ceiling
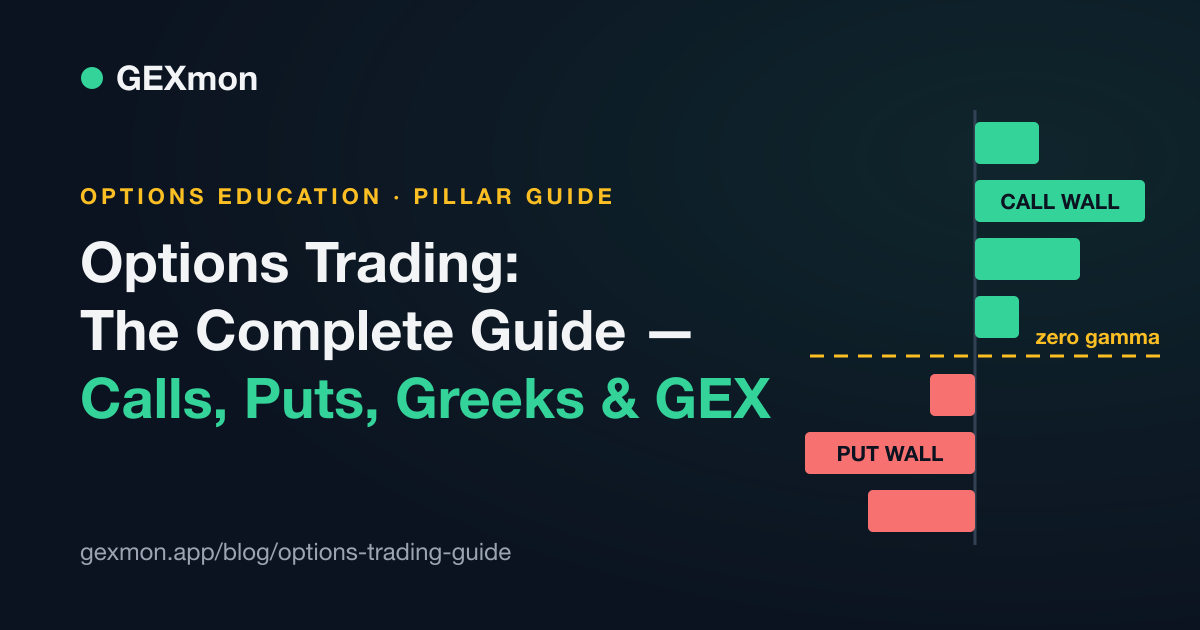
The call wall is the strike with the largest concentration of call-driven gamma. As price rallies toward it, dealer hedging sells harder and harder into the move, and long call holders taking profits sell their calls back to dealers — adding still more hedging supply. The result on a chart looks like a clean resistance rejection, sometimes a picture-perfect double or triple top. Chart traders call it resistance; the GEX chart tells you why it’s resistance. And when fresh call buying is strong enough to overwhelm dealer inventory, the wall can flip: dealer gamma turns negative there, hedging turns from suppressive to explosive, and the old ceiling becomes a floor — the breakout.
Put wall — the mechanical floor
The put wall is the mirror: the strike with the heaviest put gamma, usually below spot. Price tends to accelerate down toward it (negative-gamma hedging sells the decline), then find real buying at the level as put holders monetize and dealers, handed back those puts, are forced to buy the underlying. That’s why put walls so often print sharp V-bottoms that chartists label bear traps. If instead fresh put demand keeps pouring in below the wall, the floor fails the same way the ceiling can — and price zooms through with the old support flipping to resistance.
Zero gamma — the battle line
Zero gamma (the gamma flip) is the price where net dealer gamma crosses from positive to negative. It’s the single most important line on the map, because it separates the two regimes: above it, hedging compresses volatility and fading edges works; below it, hedging expands volatility and momentum rules. Many intraday traders treat zero gamma as a dynamic “who’s winning the session” line — price fighting around it is a battle; price accepting one side of it is a verdict.
Trading with GEX, step by step
Here is the practical workflow that professional gamma traders — and the live sessions we run — actually follow. It works for SPX and NDX options traders and equally for ES and NQ futures traders using basis-adjusted levels.
Step 1 — read the regime before the open. Is spot above or below zero gamma? Positive regime: expect two-way chop, respect the walls, favor mean-reversion. Negative regime: expect range expansion, trade with momentum, cut size — the same hedging that makes trends run also makes stops slip.
Step 2 — mark the levels that matter, in dollars. Not every bar on a GEX chart deserves a line on your chart. Rank strikes by the size of dealer hedging they represent: the call wall, the put wall, the zero-gamma flip, and any unusually large single-strike node in between. These are your session map.
Step 3 — let price come to the level, then demand confirmation. The biggest mistake is buying a put wall from fifty points away. Wait for price to actually trade into the level, then read the tape — order flow, absorption, trapped traders, a failed push through — before positioning. The level tells you where the mechanical pressure lives; the flow at the level tells you whether it’s holding today. Gamma determines how price approaches a level; fresh option flow determines whether the level holds.
Step 4 — structure your risk off the level. A level gives you an objective stop — beyond the wall, beyond the reclaim — instead of an arbitrary tick count. Targets flow naturally too: from the put wall, the first magnet is the zero-gamma line; from a rejection at the call wall, the mid-range or the flip.
Step 5 — respect the clock. Levels computed from the morning’s positioning are sharpest in the first hours of the session. As the day wears on, positions get traded around and time-driven re-hedging (charm) grows, so experienced gamma traders either refresh their data continuously or lighten their reliance on stale levels into the afternoon.
This is exactly the job GEXmon was built for: it reads live dealer gamma for SPX/ES and NDX/NQ, names the regime, ranks the walls in dollars, and flags the traps — so the five steps above take seconds instead of a spreadsheet.
Beginner mistakes and risk management
The recurring account-killers are remarkably consistent. Buying far-OTM weekly options as lottery tickets and letting theta eat them. Buying options into earnings and getting IV-crushed despite being right on direction. Selling naked options for “easy income” without a plan for the one week that isn’t easy. Oversizing because premiums look cheap — a $200 contract that goes to zero is a 100% loss, however small the ticket. Trading illiquid strikes and paying the spread twice. And revenge-trading the afternoon after a morning stop-out.
The countermeasures are equally unglamorous: risk a fixed small fraction per trade, size by max loss rather than contract count, prefer defined-risk structures while learning, check IV before buying premium, trade liquid underlyings only, paper trade new strategies first, and journal everything. Options reward process and punish improvisation — faster than any other instrument, because leverage and time decay compress the feedback loop.
Frequently asked questions
What is an option in simple terms?
An option is a contract that gives you the right, but not the obligation, to buy (a call) or sell (a put) an asset at a fixed price before a set date. You pay a premium for that right, the same way you pay a premium for insurance.
What is the difference between a call and a put?
A call is the right to buy the underlying at the strike price and gains value when price rises. A put is the right to sell at the strike price and gains value when price falls.
How much money can you lose buying options?
When you buy an option, your maximum loss is the premium you paid. When you sell (write) an option without protection, losses can be effectively unlimited, which is why selling naked options requires strict risk management.
What are the option Greeks?
The Greeks measure how an option’s price reacts to different forces: delta (price direction), gamma (how fast delta changes), theta (time decay), vega (implied volatility) and rho (interest rates). Second-order Greeks like vanna and charm describe how the first-order Greeks themselves shift.
What is gamma exposure (GEX)?
Gamma exposure is the net gamma held by options dealers across all strikes. It estimates how many shares or futures dealers must buy or sell to stay delta-neutral as price moves. Positive dealer gamma dampens moves (mean reversion); negative dealer gamma amplifies them (trending, volatile markets).
What are the call wall and put wall?
The call wall is the strike with the largest concentration of call gamma and tends to act as resistance, because dealer hedging sells into rallies near it. The put wall is the strike with the largest put gamma and tends to act as support, because dealer hedging buys into declines near it.
What is the zero gamma (gamma flip) level?
Zero gamma is the price where net dealer gamma flips from positive to negative. Above it, hedging flows tend to compress volatility; below it, the same flows tend to expand volatility. Many intraday traders treat it as the battle line for the session.
What are 0DTE options?
0DTE (zero days to expiration) options expire the same trading day. Because gamma concentrates violently near the strike as expiration approaches, 0DTE flow can dominate intraday price action in SPX and NDX, which is why session-level GEX data matters so much for day traders.
Do GEX levels work for futures like ES and NQ?
Yes. Index options (SPX, NDX) drive dealer hedging that is executed largely in the futures. Basis-adjusted GEX levels map SPX/NDX strikes onto ES and NQ prices so futures traders can use the same walls and zero-gamma level.
Is options trading risky for beginners?
Yes. Options are leveraged instruments and most short-dated option buyers lose money to time decay and volatility crush. Start small, paper trade first, understand the Greeks before risking capital, and never sell unhedged options while learning. Nothing in this guide is financial advice.
Glossary: options & GEX terms in one place
- Underlying
- The asset an option derives its value from (a stock, index or future).
- Call / Put
- The right to buy / sell the underlying at the strike price.
- Strike price
- The fixed price at which the option can be exercised.
- Expiration / DTE
- The date the contract dies; DTE = days to expiration. 0DTE expires today.
- Premium
- The option’s price × the multiplier (usually 100). The buyer’s max loss.
- Exercise / Assignment
- Using the right to buy or sell (buyer) / being obligated to fulfil it (seller).
- ITM / ATM / OTM
- In, at, or out of the money — the strike’s position relative to spot.
- Intrinsic / Extrinsic value
- Exercise value now / everything paid for time and expected volatility.
- Open interest
- Contracts currently outstanding at a strike — where positioning lives.
- Delta, Gamma, Theta, Vega, Rho
- Sensitivity to price, to delta change, to time, to implied volatility, to rates.
- Vanna / Charm
- Second-order Greeks: how delta shifts with volatility / with the passage of time.
- Implied volatility (IV)
- The market’s forecast of future movement, backed out of option prices.
- IV crush
- The collapse of implied volatility (and premiums) once an uncertain event passes.
- Market maker / Dealer
- The liquidity provider on the other side of most option trades, hedging to stay delta-neutral.
- Delta hedging
- Dealers trading the underlying to neutralize directional risk from their option book.
- Gamma exposure (GEX)
- Net dealer gamma by strike — the map of mechanical hedging pressure on price.
- Call wall / Put wall
- The strikes with the largest call / put gamma; mechanical resistance / support.
- Gamma wall
- Any strike with heavily concentrated gamma.
- Zero gamma (gamma flip)
- The price where net dealer gamma changes sign — the volatility regime switch.
- Positive / Negative gamma regime
- Dealer hedging that dampens moves (mean reversion) / amplifies them (trend, squeeze).
Where to go from here. If the second half of this guide clicked for you, the fastest way to make it real is to watch dealer gamma live for a few sessions. GEXmon tracks the regime, the walls and fresh options flow for SPX/ES and NDX/NQ in real time, with a plain-English desk note each session — and there’s a free trial, so you can put this whole guide on a chart today.
Educational content only. Nothing on this page is financial, investment or trading advice, and no outcome is guaranteed. Options involve substantial risk of loss and are not suitable for every investor. Illustrative figures use hypothetical numbers. Do your own research and consider consulting a licensed professional before trading.